New in Qwilr: Analytics - Interactions, a new timeline, and see who is viewing your pages

Back in February we announced big upgrades to Qwilr’s analytics that brings a whole new look, and more data available to track. We’re excited to share the next instalment of that upgrade.

Introducing Interactions ✨
This new tab brings a wealth of new data, including:
- Identifying buyers: Monitor who is interacting with your Qwilr pages (note that only on Enterprise plans can you enable identity and identity verification)
- Pricing and acceptance analytics: Identify friction in your buyer's journey
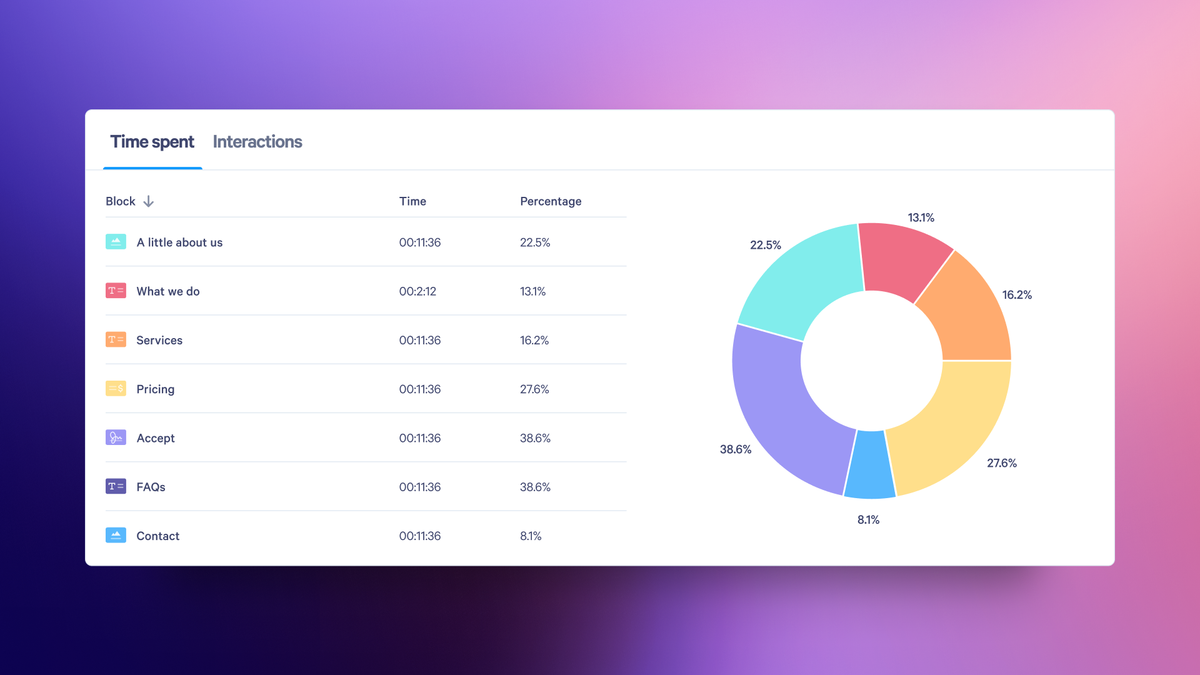
- Content analytics: Monitor how buyers engage with your content
You’ll see a new timeline that brings the entire history of the page and all the interactions together. It will show things like:
- When the page was first created
- Page status changes (when the page goes from draft to live and is ultimately accepted or declined)
- Pages viewed, who is viewing them (and where they're located)
- Engagement level changes
- More specific activity, such as whether or not a viewer interacted with a pricing quote or clicked on an ROI calculator
- A detailed timeline that shows what each person has done during a session
How to stay updated
To keep up with our newest features and releases, make sure to follow our Product Updates, and follow us on Linkedin.
Need more help understanding the newest features? Our customer support team is always available to answer questions and ensure you fully leverage all of the newest product features.
About the author
Tania Clarke|Head of Product Marketing
Tania heads up product marketing at Qwilr – looking after positioning, sales enablement, competitor intelligence and more. Tania brings experience from former roles at high growth startups like Atlassian and Safety Culture.